
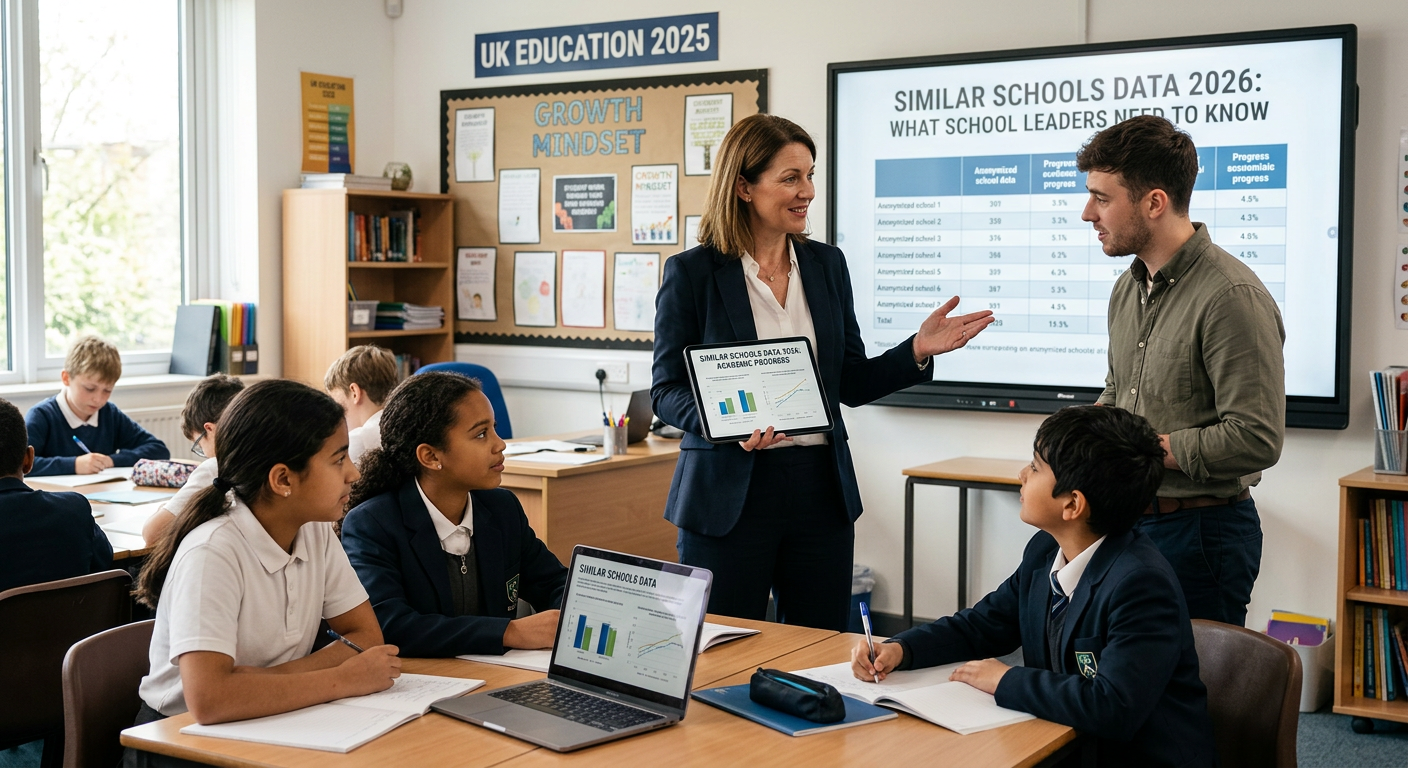
Similar Schools Data 2026: What School Leaders Need to Know
Similar Schools Data Is Here: What Does It Mean for School Assessment in 2026/27?
By Amy Rose, Director of Learning Loft
September always brings change in schools. New pupils. New staff. New priorities. New improvement plans.
But this September, there is another change that I think school leaders need to understand — not because we should be building our schools around inspection, but because it says something important about the way we use assessment data.
From September 2026, Ofsted inspectors will have access to new “similar schools” attainment data produced by the Department for Education. Rather than looking at attainment only against national figures, this additional information allows attainment to be considered alongside schools educating pupils with a similar intake.
At the same time, Ofsted’s updated inspection materials for September 2026 clarify the role of pupils’ attainment and progress compared with similar schools.
I think this raises a much bigger question for schools:
Are we collecting assessment data — or are we genuinely understanding it?
Because those are not the same thing.
What is the new similar schools model?
The Department for Education published guidance on the similar schools model for attainment in June 2026, with further technical information added in July.
The principle is relatively straightforward.
Schools operate in different contexts. A simple national comparison can tell us something, but it cannot tell us everything.
The new model therefore provides additional contextual information by allowing attainment to be considered alongside schools with similar pupil intakes.
The DfE says the information is intended for school leaders responsible for improving attainment, as well as governors and trustees responsible for overseeing schools and holding leaders to account.
Importantly, this isn’t just about inspection. The guidance also describes how contextual analysis can support school self-improvement.
And that is the part that interests me most.
This shouldn’t become another Ofsted exercise
Whenever inspection guidance changes, there is an understandable temptation for schools to ask:
“What do we need to produce for Ofsted?”
I think that’s the wrong starting point.
Assessment systems should not exist because an inspector might want to see them.
They should exist because a Year 6 teacher needs to know which pupils haven’t secured fractions.
Because a head of English needs to know why one cohort is underperforming on evaluation questions.
Because a SENDCo needs to be able to explore whether there are patterns in the assessment performance of pupils with SEND.
Because a subject leader needs to know whether last term’s intervention actually worked.
Because a headteacher needs to be able to move beyond “our results went down” to understanding why they went down and what the school is going to do about it.
Ofsted’s own guidance around the Inspection Data Summary Report makes an important point here. The IDSR is intended to inform conversations between inspectors and leaders. It does not, on its own, provide a complete picture of a school.
Data provides a starting point.
Professional understanding provides the meaning.
The real question is what sits underneath the headline
Imagine two schools both achieve broadly similar outcomes in mathematics.
On a spreadsheet, they may look alike.
But underneath those headline results, the story could be completely different.
In School A, pupils may be secure in number and calculation but consistently struggle with mathematical reasoning.
In School B, reasoning may be relatively strong, but fractions and proportional reasoning may be creating significant gaps.
The headline attainment figure doesn’t tell us that.
Now take it down another level.
Perhaps the overall cohort appears secure, but disadvantaged pupils are performing considerably less well on multi-step problems.
Perhaps girls and boys achieve similar total marks but show different patterns by topic.
Perhaps pupils with SEND are succeeding on knowledge-based questions but finding questions requiring extended application more difficult.
Perhaps one class has a gap that doesn’t appear elsewhere in the year group.
That’s where assessment data becomes useful.
Not when it tells us the score.
When it helps us decide what to do on Monday morning.
Five questions I think every school should ask about its assessment data
1. What are the actual curriculum gaps?
A percentage tells me how much a pupil got right.
It doesn’t necessarily tell me what they don’t know yet.
If a pupil scores 62%, the important question isn’t simply whether 62% is above or below a threshold.
Which 38% did they miss?
Were those questions connected?
Was there a particular curriculum domain?
Was it knowledge, application or technique?
Was the same pattern visible across the class?
Good assessment analysis should lead us back to the curriculum.
2. Are we looking beyond whole-cohort averages?
Averages are useful, but they can hide pupils.
If 70% of a cohort performs well, we still need to know what is happening with the other 30%.
We should also be able to explore meaningful pupil groups without reducing children to labels.
The purpose of group analysis should be to ask better questions:
Is there a pattern here? Why might it exist? What can we do about it?
Not simply to create another coloured box for a report.
3. Can teachers actually use the information?
This is one of my biggest frustrations with school data.
We can create extraordinarily sophisticated spreadsheets that nobody has the time or inclination to use.
If assessment analysis takes hours to produce and results in six pages of numbers, we need to ask whether the process is serving teachers or whether teachers are serving the process.
A class teacher should be able to look at assessment information and quickly identify:
These are the two things my class needs me to revisit.
That is actionable information.
4. Do we know whether intervention worked?
This is the bit that is often missing.
Assessment identifies a gap.
We reteach it.
Then what?
If our assessment system cannot help us see whether that gap subsequently narrowed, we’re only doing half the job.
The most useful assessment cycle isn’t:
Test → analyse → file away.
It is:
Assess → identify → respond → reassess → evaluate.
That final stage matters enormously.
5. Can leaders explain the story without drowning in data?
School leaders should know their data.
But knowing your data doesn’t mean memorising every percentage on a spreadsheet.
It means understanding the story.
Where are pupils doing well?
Where are the significant gaps?
Are those gaps isolated or systemic?
Which groups require closer attention?
What have we already changed?
What evidence suggests that change is working?
And what needs to happen next?
That is a far more meaningful conversation than simply reciting attainment figures.
Where question-level analysis fits
This is why I remain such a strong advocate of question-level analysis (QLA) when it is used properly.
QLA allows schools to move underneath the total score and look at performance question by question.
That can reveal patterns that the headline result simply cannot.
But there is an important caveat.
QLA is only useful if someone acts on it.
Producing an enormous spreadsheet after every assessment and saving it in a shared drive is not school improvement.
Identifying two significant curriculum weaknesses and adapting teaching because of them might be.
The analysis should reduce uncertainty, not create another workload.
Why we built LoftTrack
This exact problem is why we developed LoftTrack at Learning Loft.
I didn’t want teachers spending evenings manually building spreadsheets simply to discover something technology could have surfaced much more quickly.
LoftTrack takes assessment information and turns it into usable analysis, including question-level performance, cohort trends, individual pupil information and pupil-group analysis.
But the important part for me isn’t simply what the technology can produce.
It’s what teachers can do with that information afterwards.
A piece of software can identify a pattern.
It cannot know a class like its teacher does.
It might highlight that a particular question or curriculum area was unusually weak across a cohort.
The professional then asks why.
Was the content taught sufficiently?
Was there a misconception?
Was the wording unfamiliar?
Did pupils know the content but struggle to apply it?
Does something need reteaching?
That’s the relationship I want between technology and teaching.
Technology does the heavy lifting. Teachers do the thinking.
What should schools do about the September 2026 changes?
I don’t think schools need to panic or suddenly invent another assessment process.
In fact, I would argue for the opposite.
Use this as an opportunity to simplify.
Look at your current assessment system and ask:
What information are we collecting?
Why are we collecting it?
Who uses it?
What decisions does it actually change?
How long does it take staff to produce?
Could we get the same — or better — insight with less workload?
The arrival of similar-schools data should not lead to another spreadsheet.
It should encourage better conversations about context.
If your school’s attainment differs from similar schools, the interesting question is not simply whether it differs.
It’s why.
And the answer is unlikely to be found in a single headline percentage.
You need to look underneath it.
Better data should create better questions
I’ve worked with schools for years, and the most useful data conversations I’ve seen have rarely started with somebody presenting an enormous spreadsheet.
They start with a question.
Why did this happen?
Which pupils are affected?
What haven’t they understood?
What are we going to change?
How will we know whether it worked?
That is what assessment should give us.
The similar-schools model gives leaders another useful piece of context.
But context isn’t diagnosis.
National data isn’t diagnosis.
A headline result isn’t diagnosis.
Even QLA isn’t diagnosis on its own.
They are pieces of evidence.
The expertise still sits with the people who understand the curriculum, the classroom and the children.
And that’s exactly where it should stay.
Frequently Asked Questions
What is the similar schools model for attainment?
The similar schools model is contextual attainment information produced by the Department for Education. It allows a school’s attainment to be considered alongside schools educating pupils with a similar intake, giving leaders another point of comparison alongside national information.
Will Ofsted use similar schools data?
Yes. The DfE’s guidance states that Ofsted inspectors will have access to the data from September 2026. Schools should not, however, see this as a reason to produce additional data purely for inspection.
Do schools need to create new assessment data for Ofsted?
The focus should be on having assessment processes that genuinely support teaching, curriculum decisions and school improvement rather than generating information simply for inspection. Schools should understand the information they already collect and, crucially, be able to explain how they respond to it.
What is question-level analysis?
Question-level analysis breaks assessment performance down question by question rather than relying only on an overall mark. It can help schools identify common curriculum gaps, individual pupil needs and areas that may require reteaching.
How can schools make assessment data more useful?
Start with the decision the data needs to inform. Prioritise information that helps teachers identify curriculum gaps, individual pupil needs, patterns between groups and whether subsequent teaching has improved outcomes. If data is being collected but doesn’t change anything, it is worth questioning why it is being collected.
What is LoftTrack?
LoftTrack is Learning Loft’s assessment and question-level analysis tool. It helps schools turn assessment information into clearer pupil, cohort and group-level insights, reducing the need for teachers and leaders to manually analyse large spreadsheets.
Final thought
Schools don’t need more data for the sake of having more data.
They need better insight from the data they already have.
For me, that should be the real conversation prompted by the introduction of similar-schools data in 2026/27.
Not:
“What will Ofsted want to see?”
But:
“What does our assessment information tell us about our pupils — and what are we going to do about it?”
If your school is looking at how assessment analysis could become quicker, clearer and more useful for teachers and leaders, you can explore LoftTrack by Learning Loft and see how we’ve approached the problem.
Because ultimately, better assessment shouldn’t mean more workload.
It should mean better decisions.